Going Beyond Numbers, Lines and Graphs
Mar 19
/
Karmel Gandahusada

There's more to data than numbers, lines, and graphs. If you are analysing paragraphs of text, keyword analysis is a great way of seeing what the main topic of the text is. And what better way of showing the most frequent keywords through the use word-clouds?
With the help of two Python packages, wordcloud and nltk, we are able to quickly clean up our desired text, and show the most frequent keywords we have in a word-cloud. Let's check out how to do so.
With the help of two Python packages, wordcloud and nltk, we are able to quickly clean up our desired text, and show the most frequent keywords we have in a word-cloud. Let's check out how to do so.
These are the necessary packages we require for the word-cloud. Now the first think I want to do is to scrape all the words from all Breaking-Bad scripts and place them into a string. You can tell I'm a big fan of the show.
Now, comes the construction of a function that will clean up the text. The dialogue right now is messy, with many filler words and bits of grammar we need to clean up.
Now we have our cleaning function, let's use it to clean our text, and create our first word-cloud! Also note that since the text is a script for mostly informal dialogue, it is not as concise as a written paragraph. There are still many words that are meaningless in a keyword analysis, and as such extra measures are taken to remove more meaningless words.
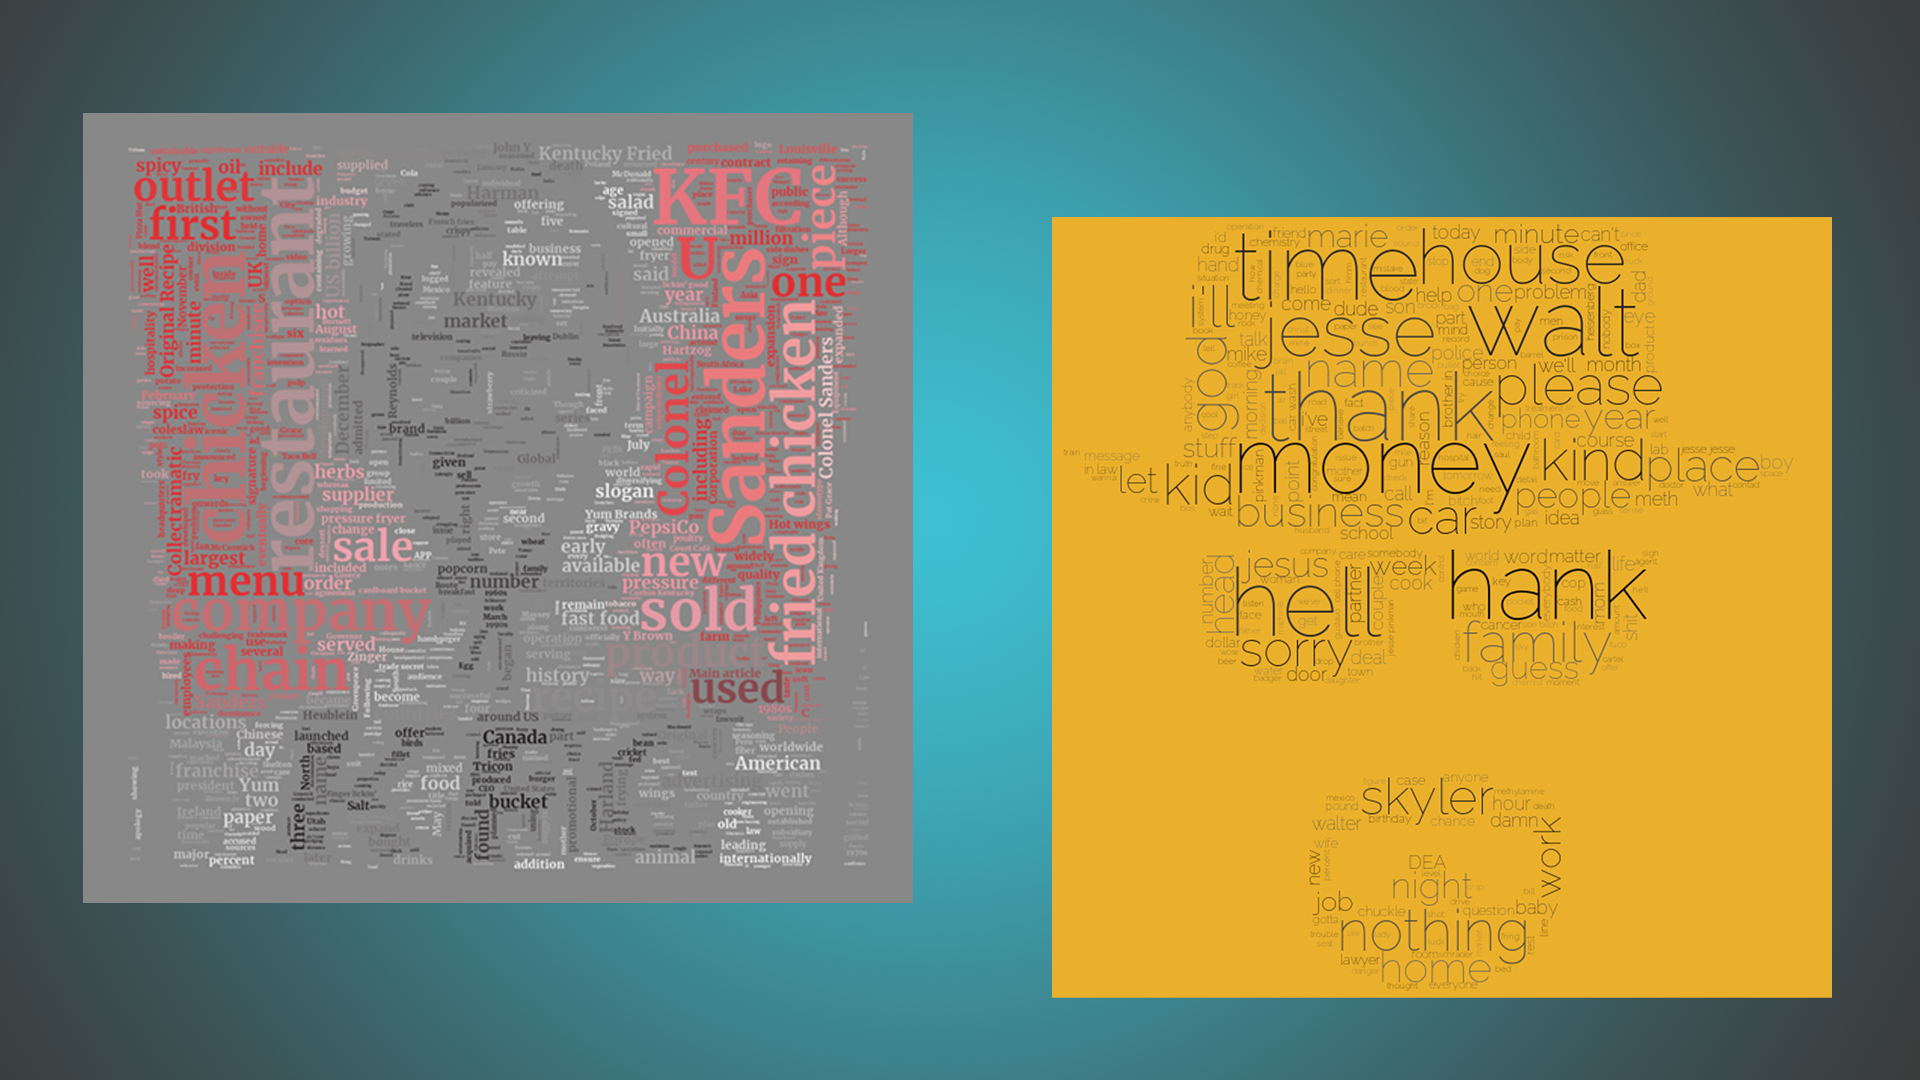
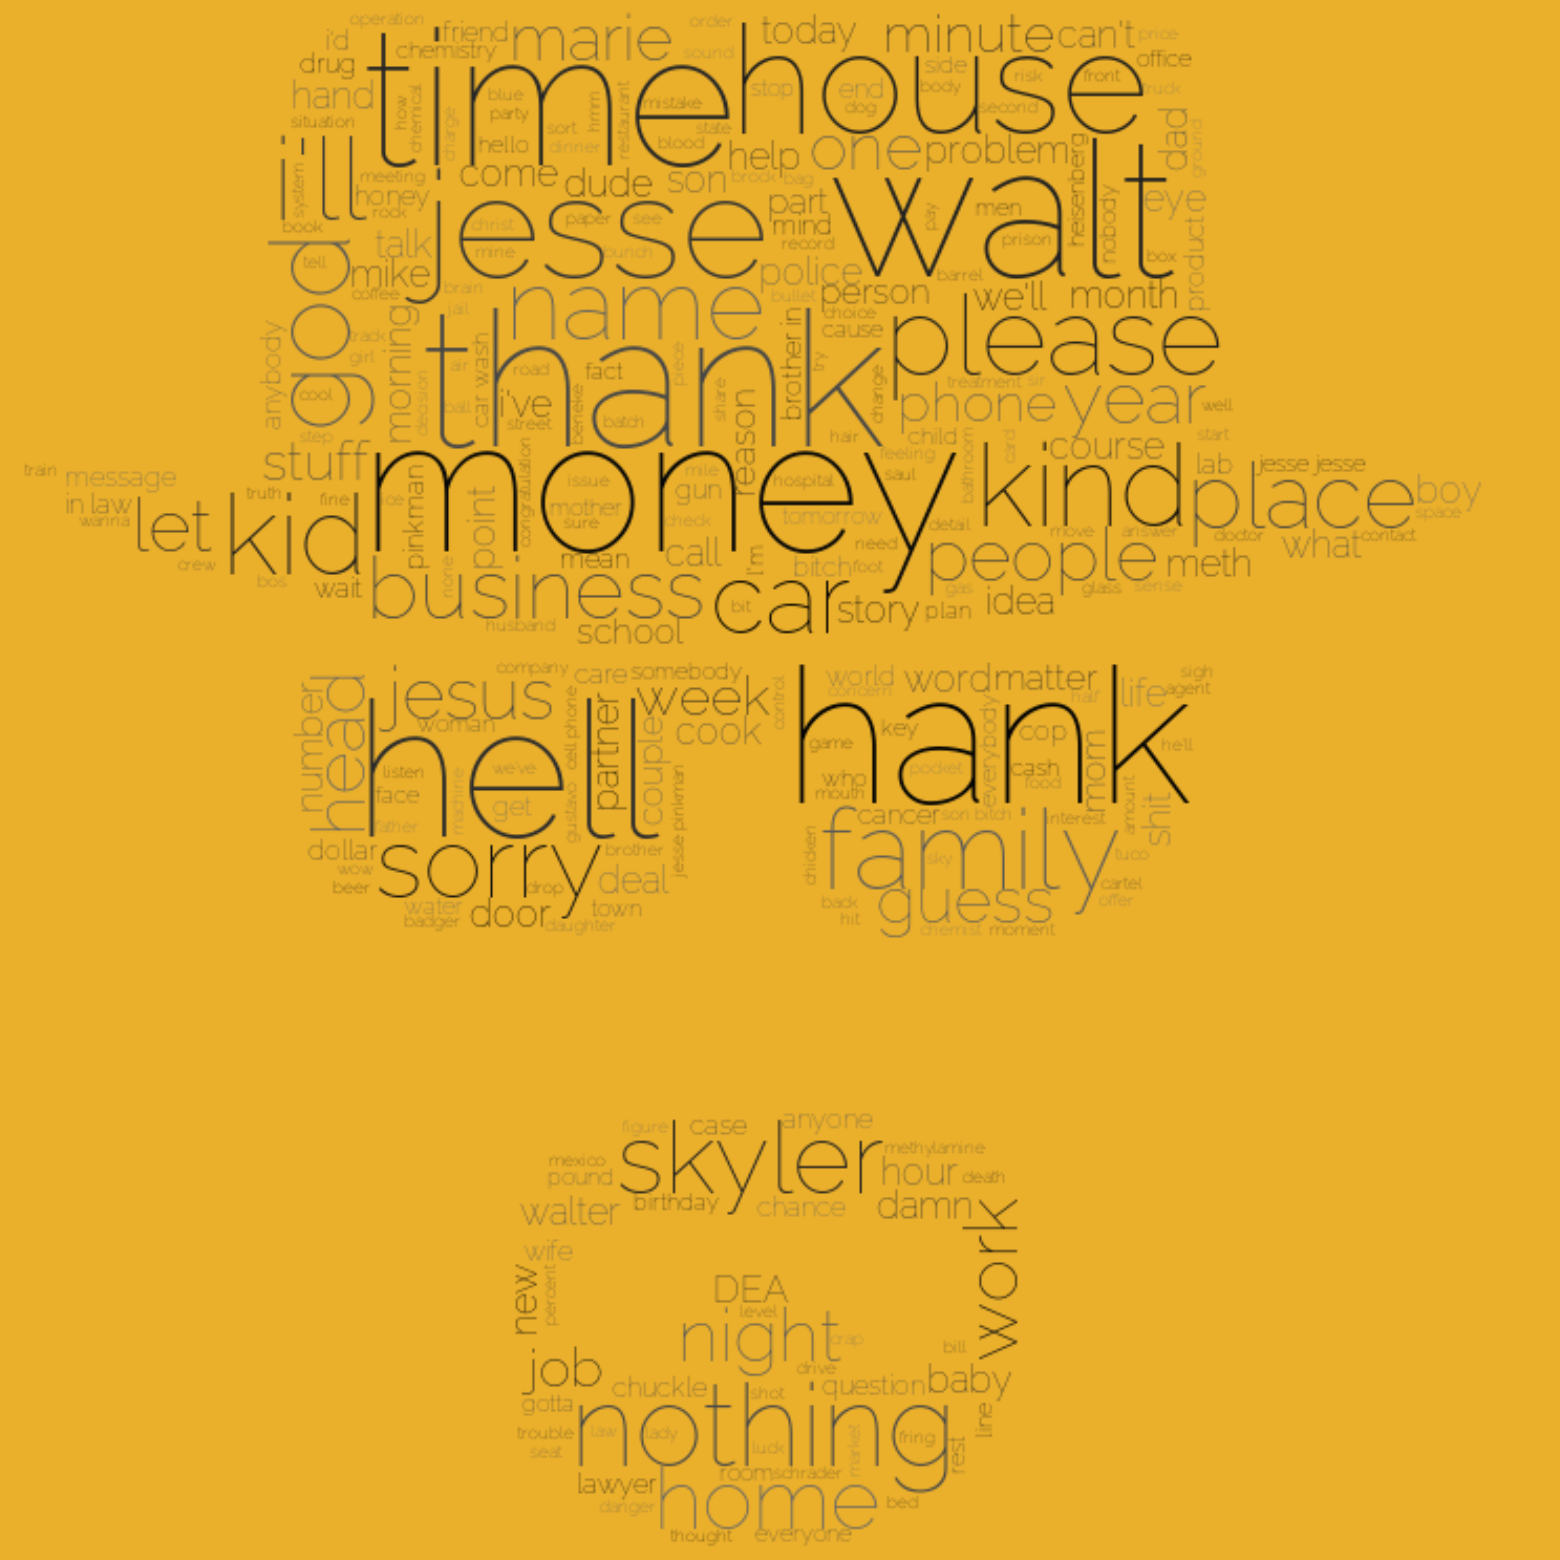
The breakingbad.png you see in the code is pictured on the left visualisation. It is a mask for the wordcloud package to use as a reference. The image on the right is produced when you run the code above. Even without numbers of the word count, you can tell who are the main characters (Hank, Walt, Jesse, etc) and the themes of the show (money, business, hell, family, time).


Now we will try generating text from KFC's Wikipedia page. I have copied the words from there and placed them in a file which I called kfc.txt.
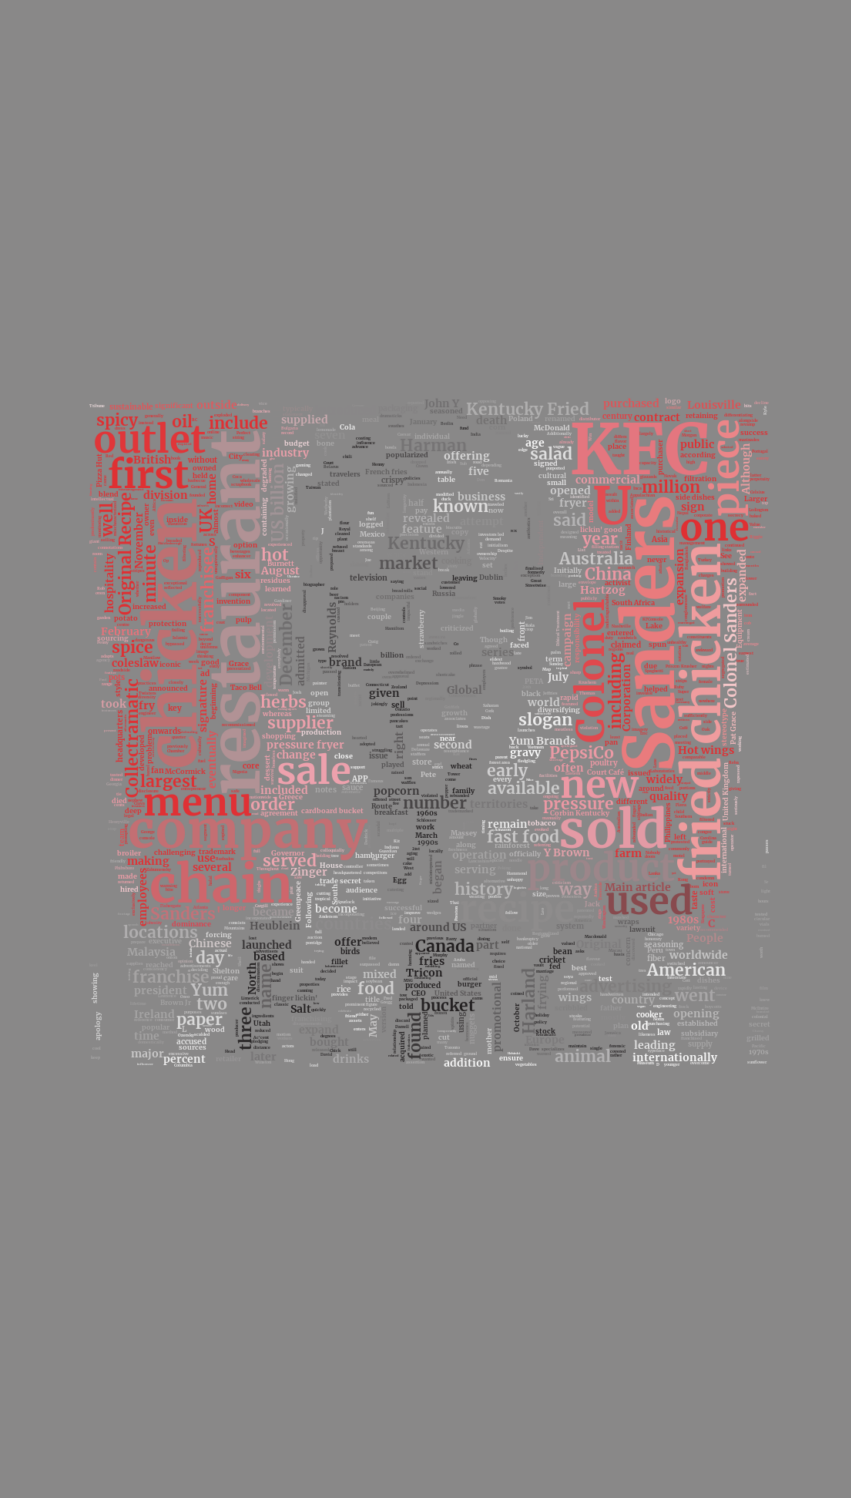
I used the mask pictured on the left, and wanted a word-cloud to imitate the same colours and shape. This time, I wanted more words in the word-cloud, so I altered the WordCloud object to have a parameter of max_words=5000. The output on the right is stunning, as it follows the colours and shape of the logo nicely. You can even make out the KFC lettering and the shape of the Colonel Sanders. Not bad for someone without an art degree!


Statistical analysis is crucial for investigating any data, but an effective visualisation is also important. At the end of the day, professional data analysts have to display their findings to audiences without prior knowledge of statistical analysis. Word-clouds are not only effective in showcasing the keywords of the text, but are eyepopping and pleasing to look at when done correctly!

We at Data Professional Academy are dedicated to nurturing the next generation of data professionals. We are the only learning platform that guarantees career support until you land your first data job. If you want to land your first data job, join us today.
Copyright © 2024 Data Professional Academy | ABN 86 670 807 333
FEATURED LINKS
CONNECT WITH US
-
Facebook
-
Twitter
-
YouTube
-
Instagram
-
LinkedIn

